How to use the YouTube Daily Views tool
The YouTube Daily Views tool tracks daily global YouTube views for popular music artists, helping you get an edge on Kalshi's weekly and monthly "Highest daily view count" markets. Each market asks whether an artist's views will top a set number (like 7M) on any single day during the week or month.
This tool is included in all Prediction Markets Pro subscriptions at no extra cost.
What's included
- Live Kalshi prices – Current prices for each artist's weekly and monthly markets
- Daily Views by Week – Compare this week's daily views to past weeks and the 12-week average
- Day-by-day comparison – See how each day this week stacks up against the average for that day
- Highest Daily Views by Week – The top single-day view count for the current week and each of the previous 16 weeks, plus which day of the week it happened on
How to use the tool
1) Pick an artist
Start on the YouTube Daily Views page and choose an artist. Each card shows how many of that artist's markets are currently open on Kalshi.
2) Check the live Kalshi prices
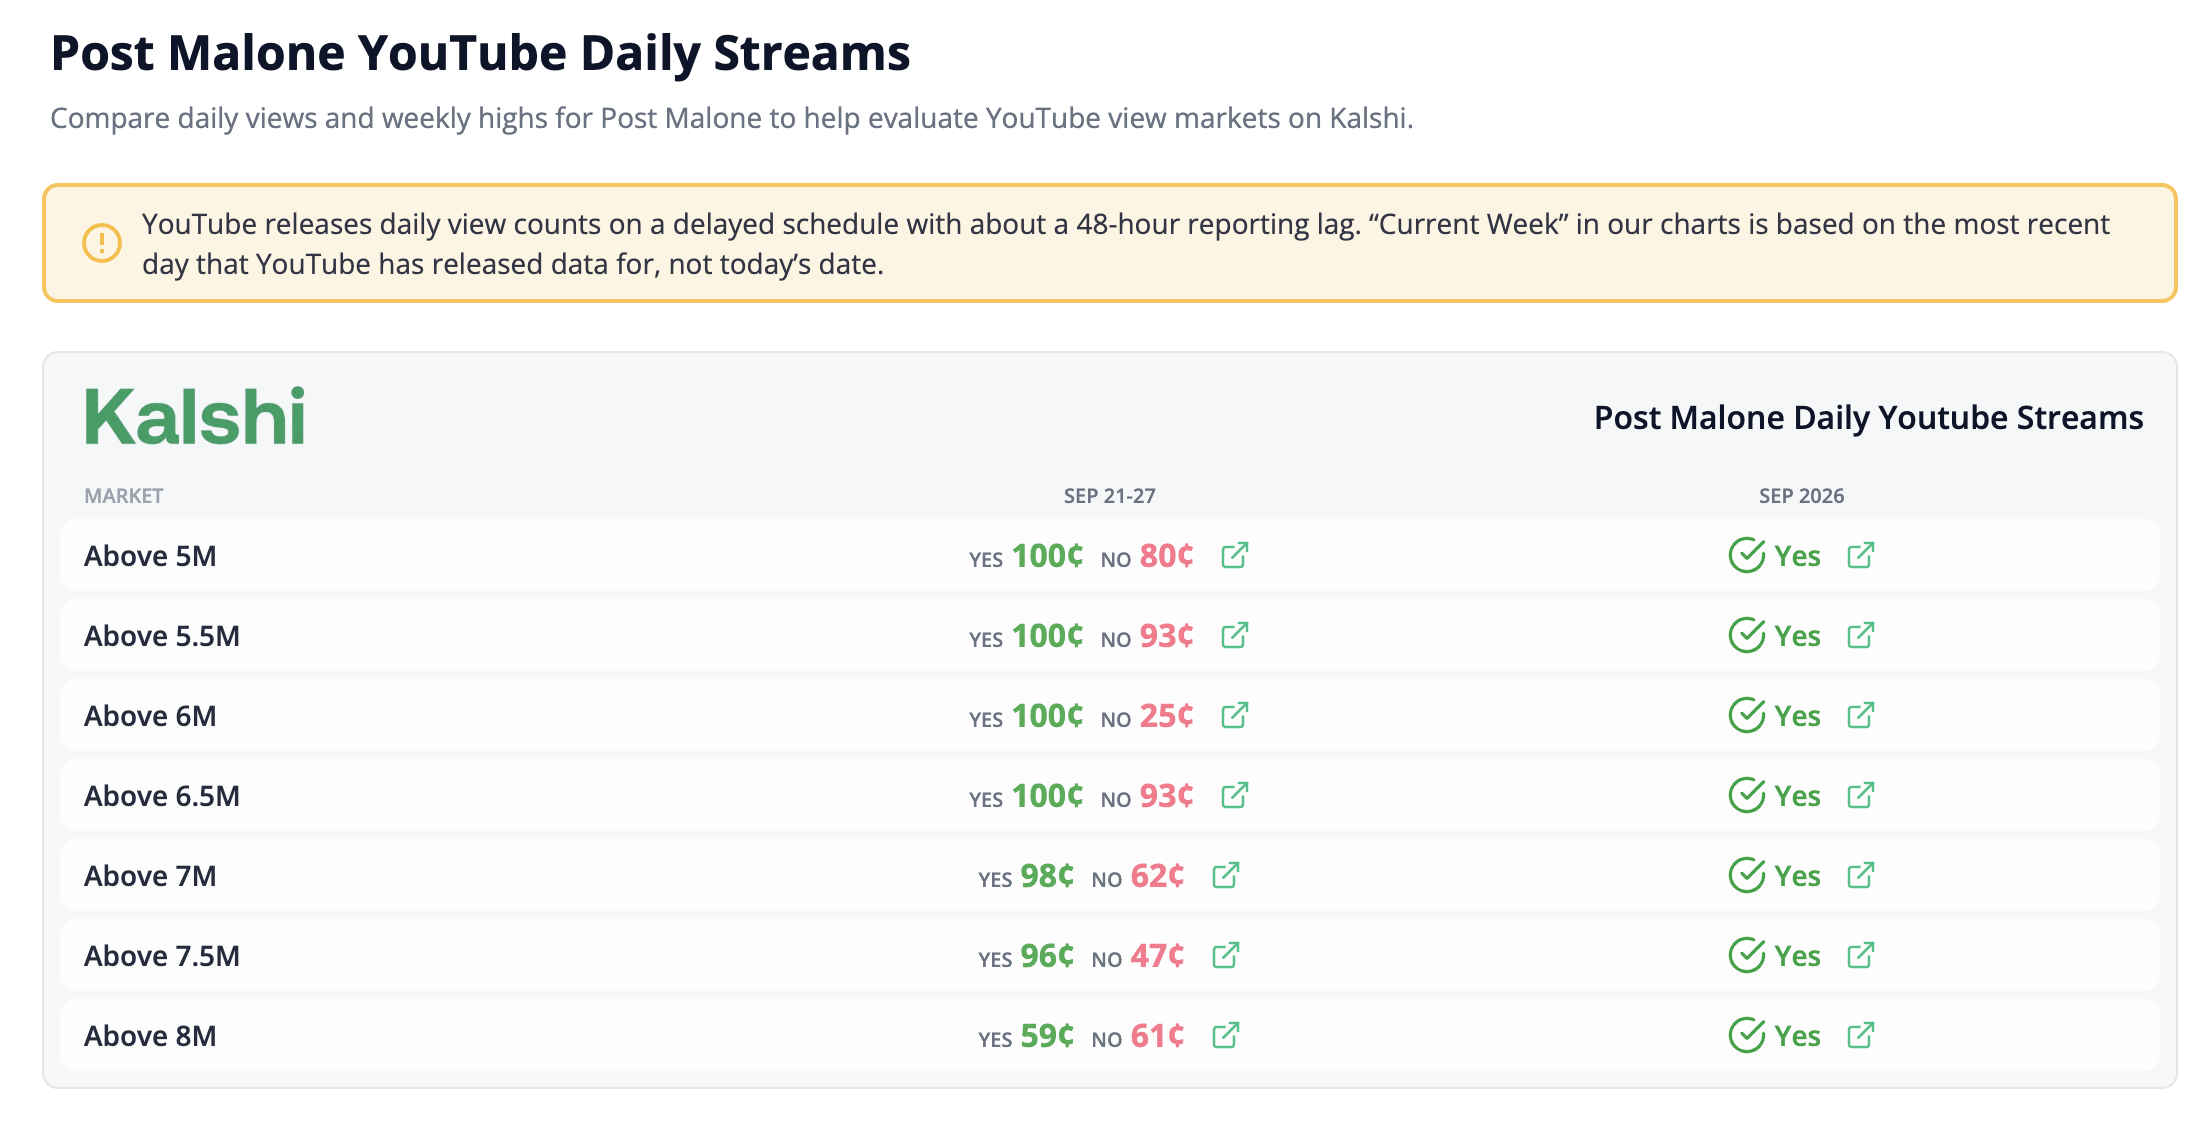
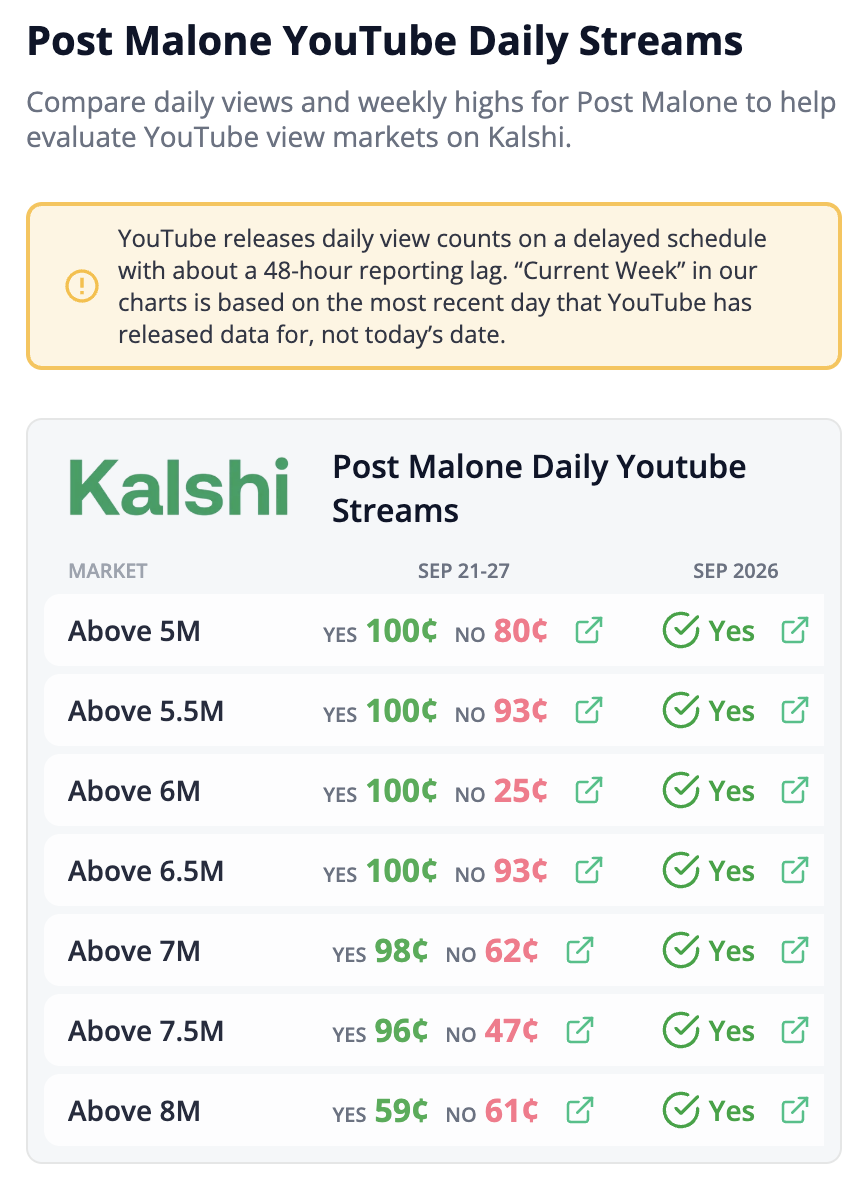
The Kalshi table at the top of the page shows every threshold for the artist's current weekly market (like Sep 21-27) and monthly market (like Sep 2026), with live Yes and No prices. Click the link icon next to any price to open that market on Kalshi.
3) Compare daily views by week
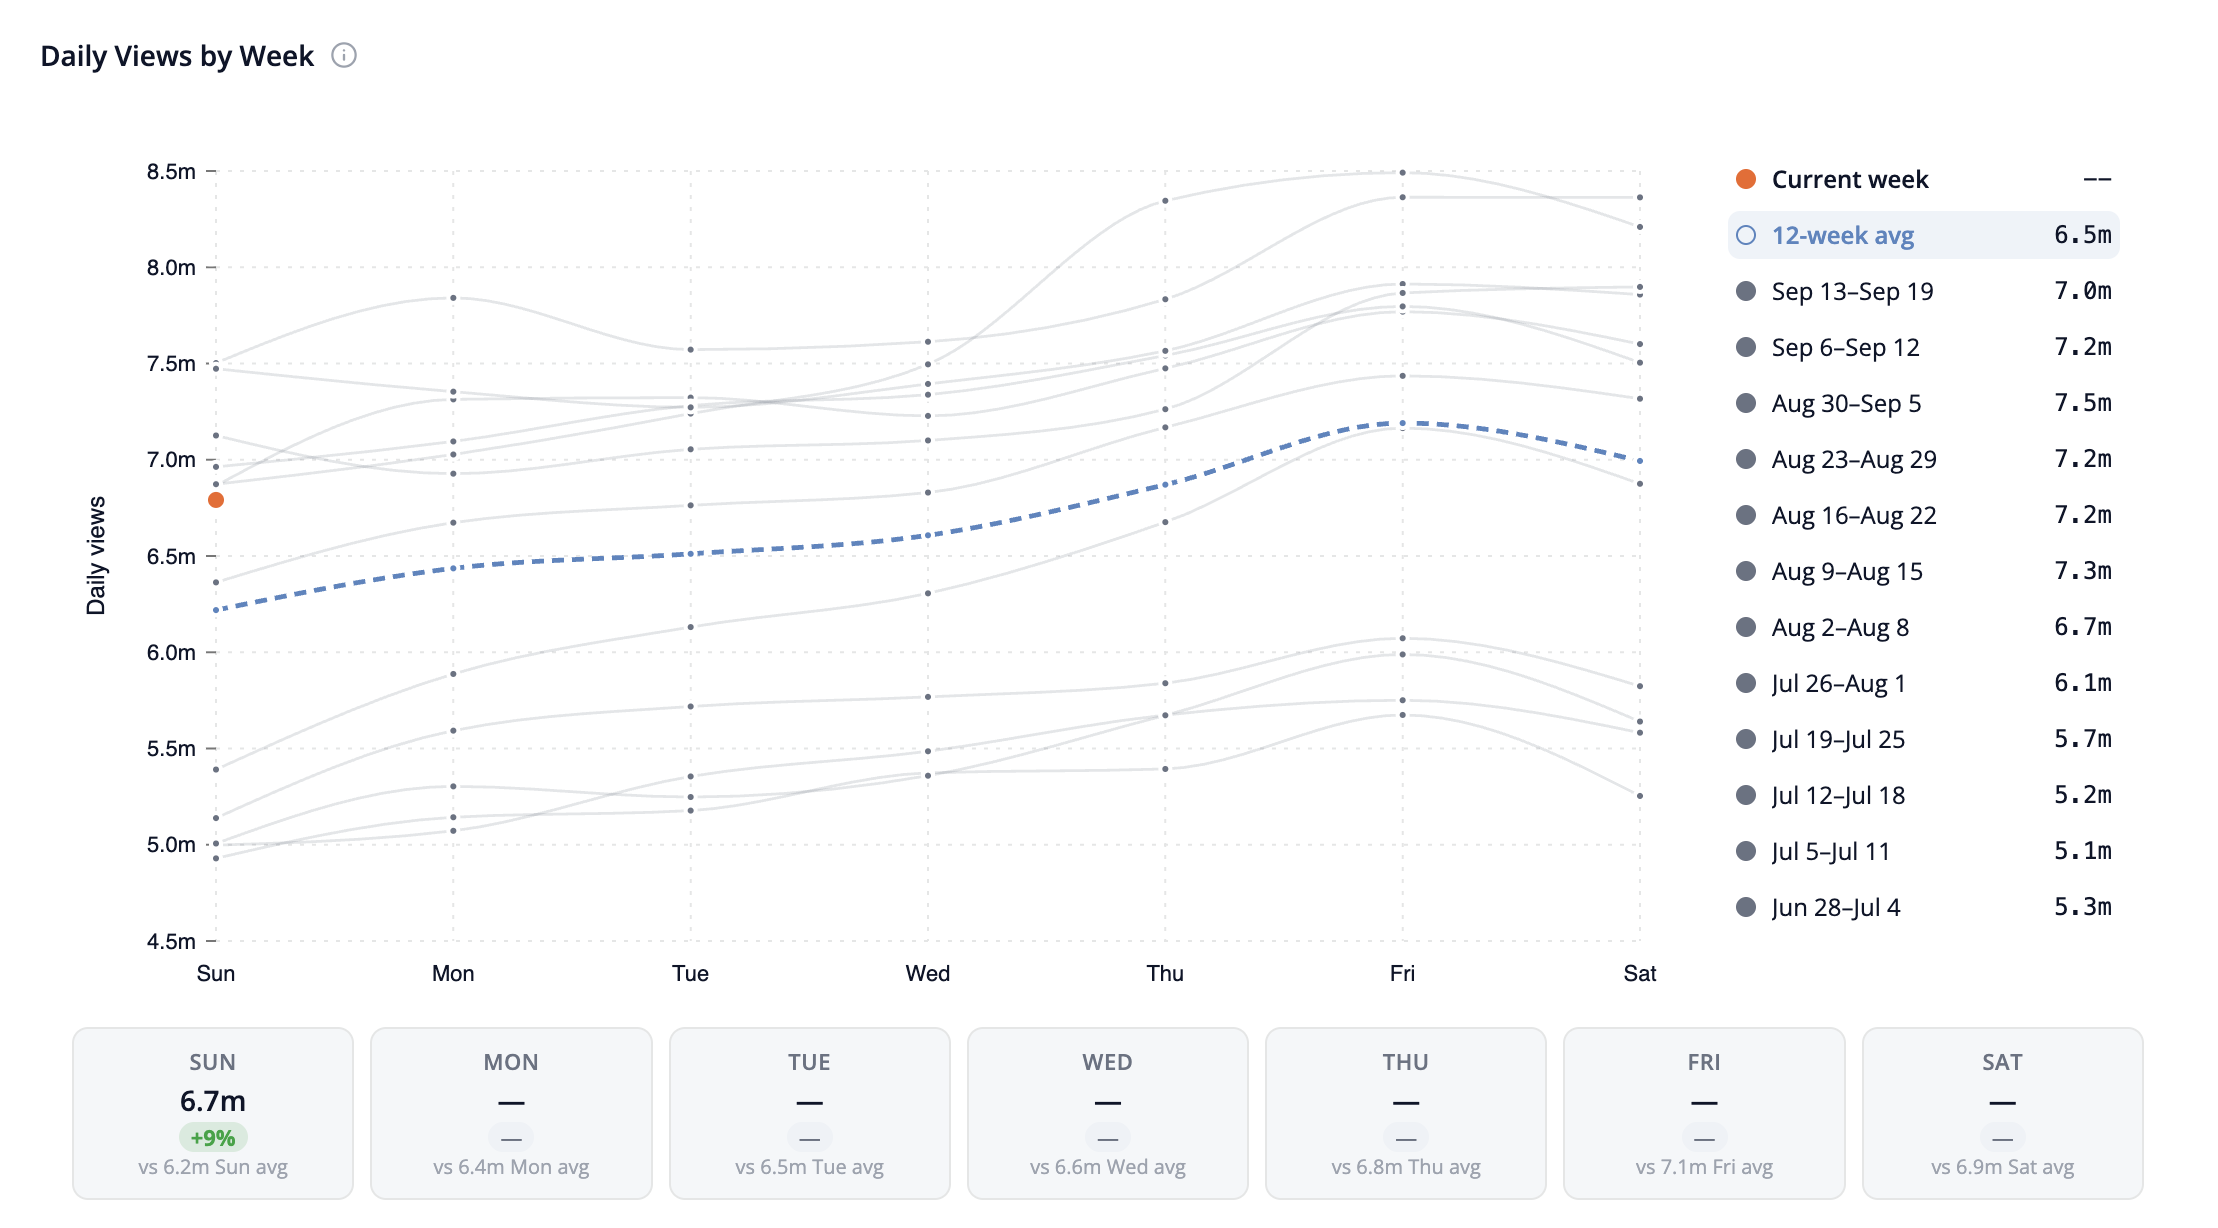
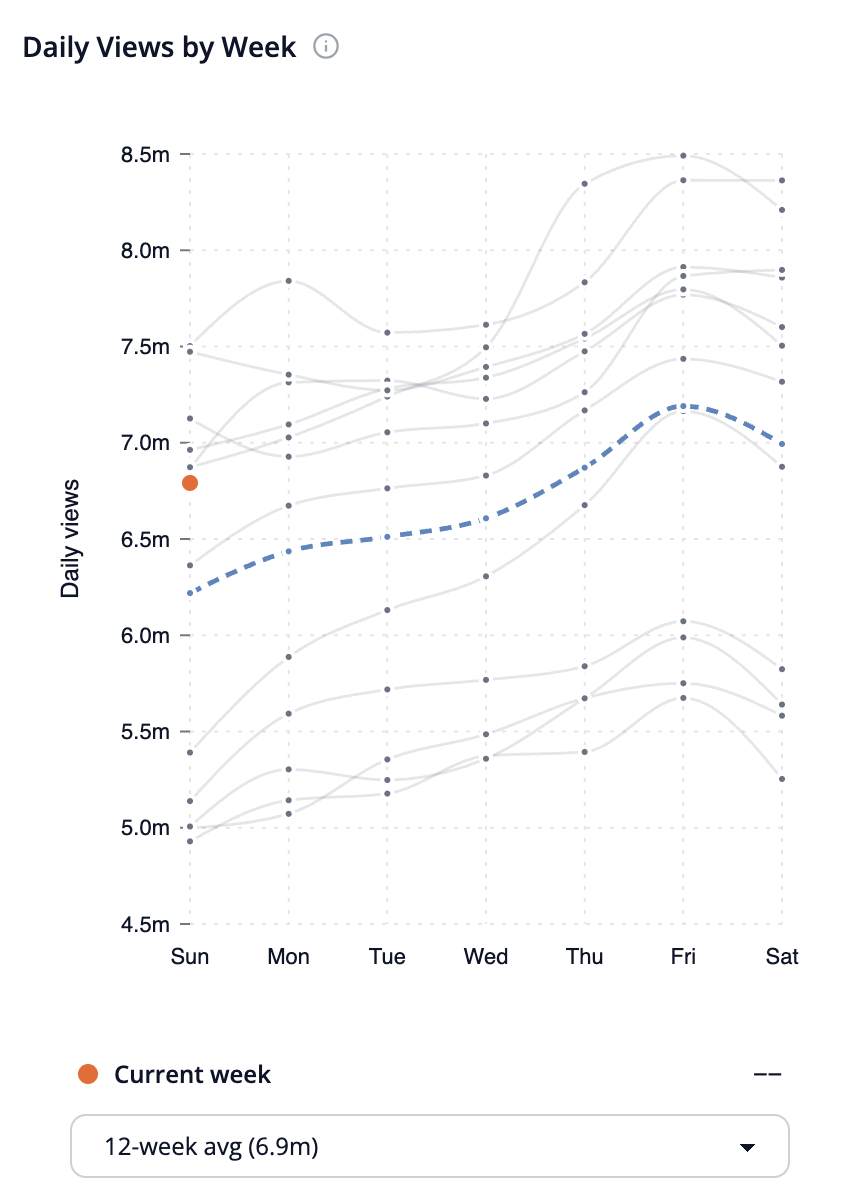
The Daily Views by Week chart plots each day's views (Sunday through Saturday) for the last 12 weeks. The current week is highlighted in orange, and the 12-week average is shown as a dashed line.
By default, the current week is compared to the 12-week average. To compare it to a specific past week instead, select that week from the list next to the chart (desktop) or the dropdown below it (mobile).
YouTube releases daily view counts with about a 48-hour reporting lag, so "Current week" is based on the most recent day YouTube has released data for, not today's date.
4) Review the day-by-day comparison and weekly highs
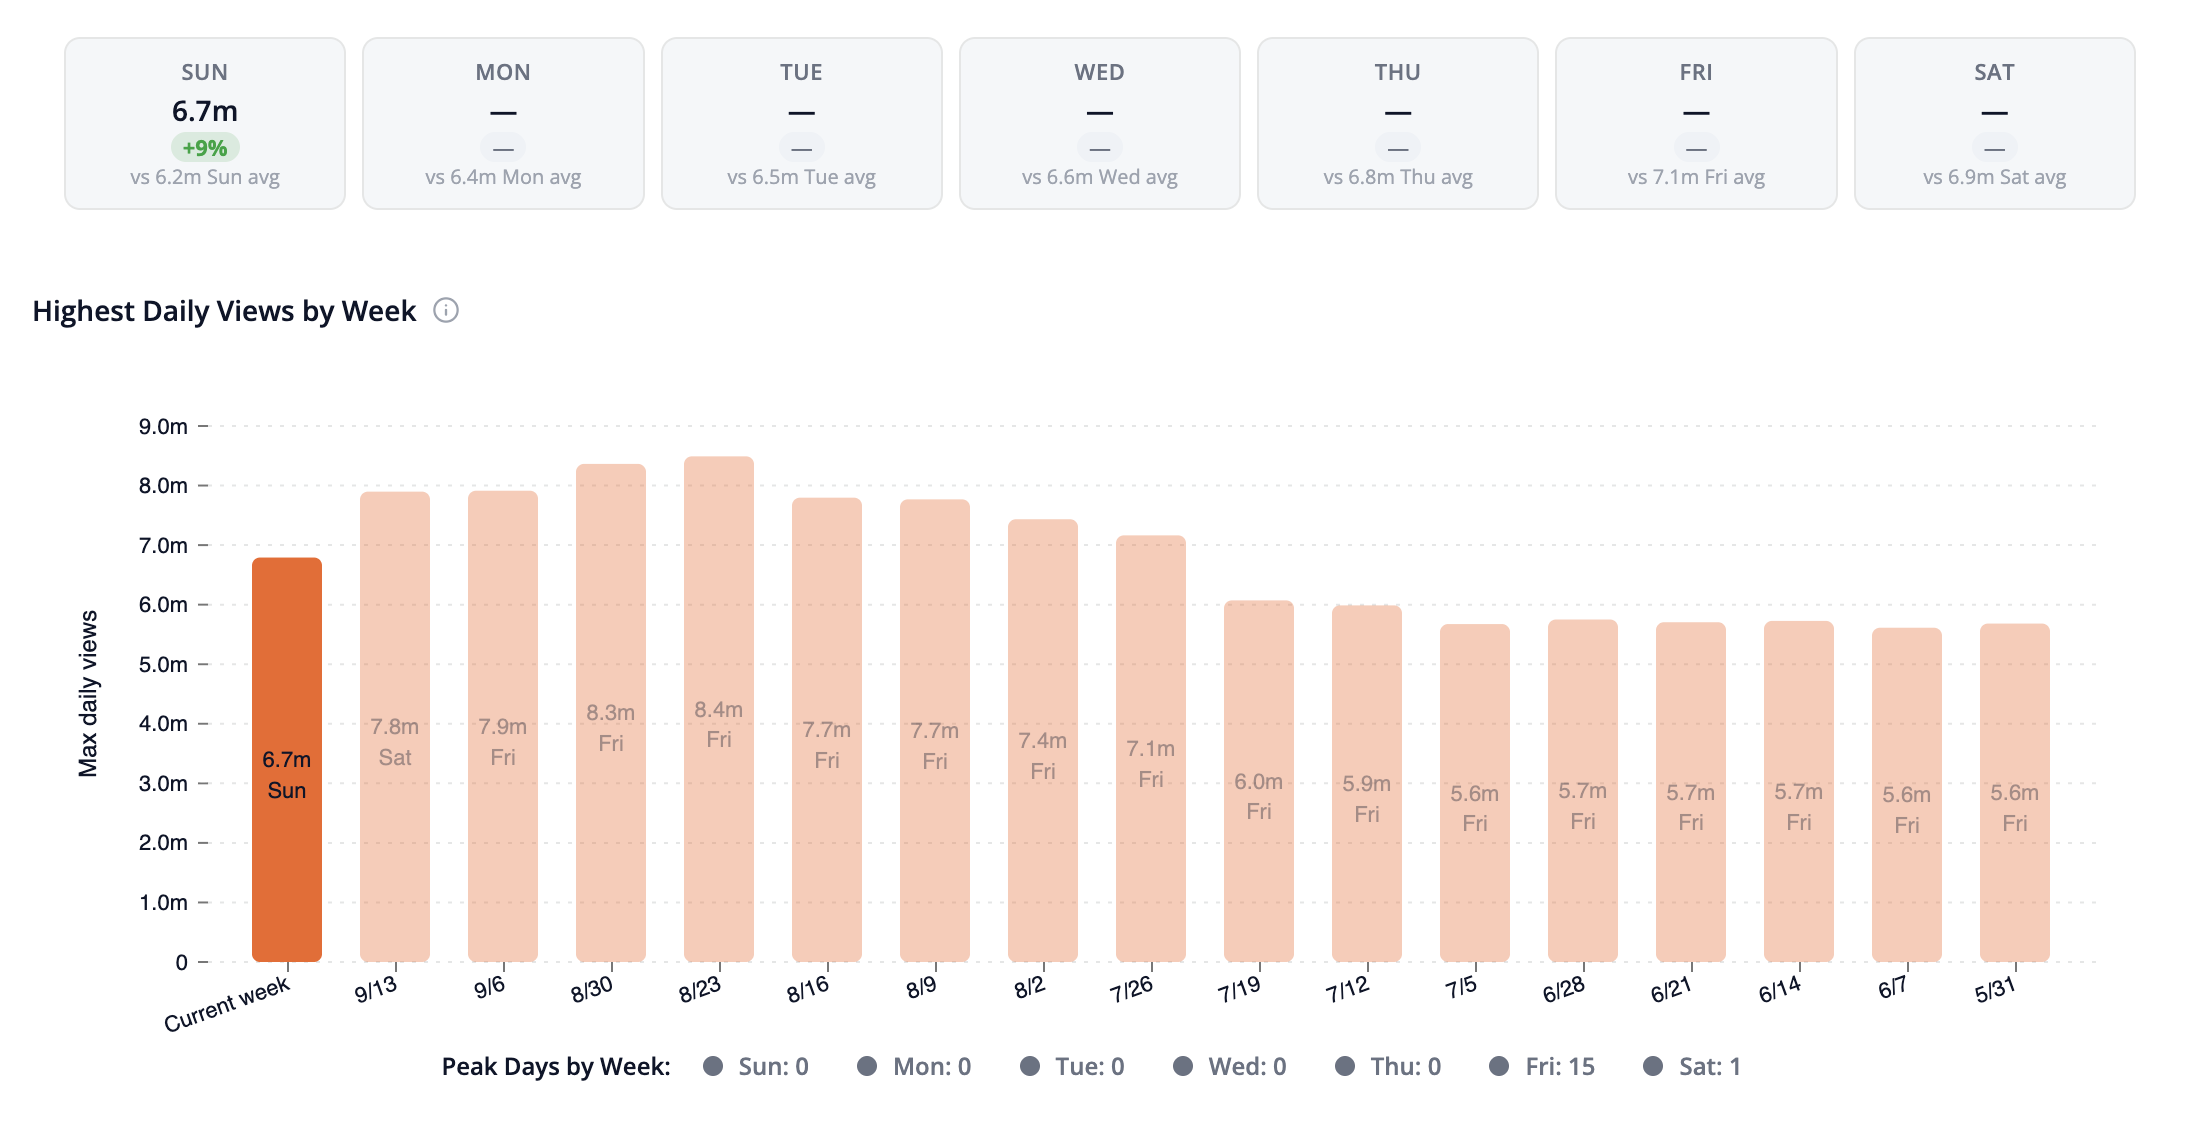
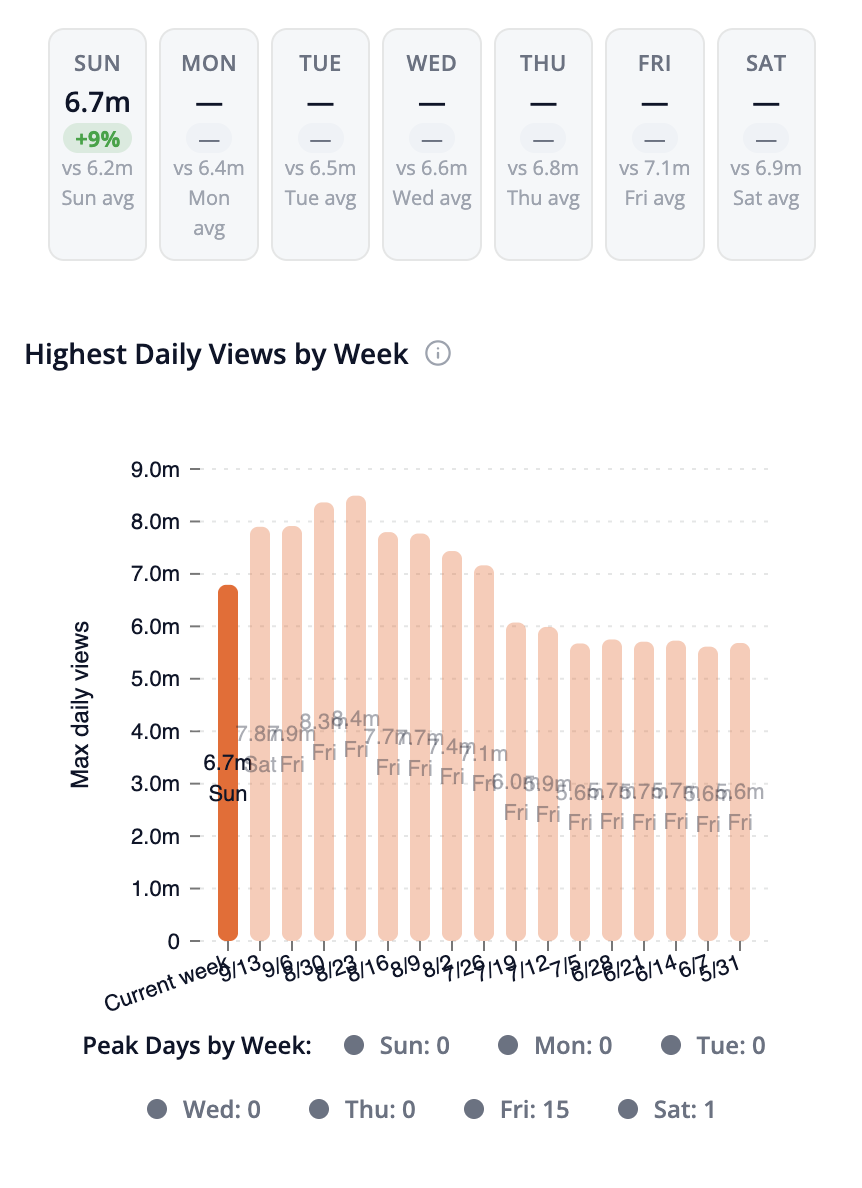
Below the chart, a card for each day of the week shows the current week's views and how they compare (as a percentage) to the average for that day, or to the week you selected.
The Highest Daily Views by Week chart shows the top single-day view count for the current week and each of the previous 16 weeks, which is the number Kalshi's markets settle on. Each bar is labeled with the day of the week that peak happened, and the Peak Days by Week summary counts how often each day was the peak. Click a day in the summary to highlight the weeks that peaked on that day.
How to use the data
Compare the thresholds on Kalshi to how often the artist has hit those numbers in past weeks. If an artist's weekly high has cleared 7M in most recent weeks, a "Yes" on Above 7M may be underpriced, and vice versa.
Pay attention to peak days, too. Many artists peak on the same day most weeks (often Friday, when new music is released), so a quiet start to the week doesn't necessarily mean a threshold is out of reach.
Note: Free accounts see limited data. Prediction Markets Pro subscribers get full access.